
Low-Cost Ventilator Design for Pandemic Situation
Report Includes:
- System Design
1.1. Overall System Architecture
1.2. BVM-Ventilator Design
1.3. Electrical System Architecture - Controls and Simulation
2.1. Multi-Compartment Model for Lungs
2.2. Applying Ventilator Support to Under-Respiring Lungs
2.2.1. Under Respiring Lungs
2.2.2. Introducing Ventilation Support System
2.3 References for this section - Further Research, Progress, and Updates
3.1.A. Prototype 1
3.1.B. Prototype 2
3.2.A. Updated Control Design - Ventilator Pressure Variation with Lung Diseases
1. System Design
1.1. Overall System Architecture
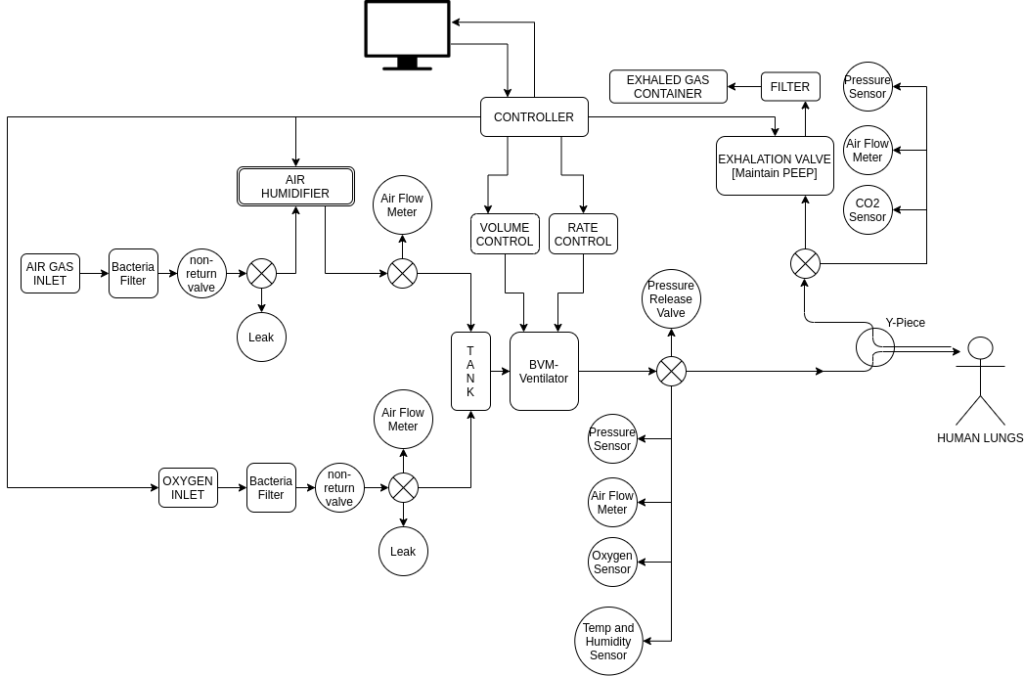
The above is the initial Design – Checkout Section 4 for updated designs and schematics.
- The system architecture is subdivided into the control circuitry and mechanical units.
- Air from the inlet is first passed through a humidifier and oxygen is mixed, in order to achieve the desired percentage of humidity and oxygen.
- This is passed at a desired rate to the BVM and subsequently to the person for inhalation, and the exhaled air is then passed through a controlled PEEP valve.
- Controlled actuation is done using a stepper motor coupled to a slider-crank mechanism which brings about the compression and extension of the bag.
- Pressure sensor, air flow meter, humidity sensor, oxygen level sensor, etc. generate feedback for the controller.
- The control loop is implemented electronically, in order to achieve desired pressure and flow rate, along with maintaining the oxygen, humidity levels in the air.
- Safety checks have been implemented such as pressure release valves, bacterial filters, one-way valves, etc.
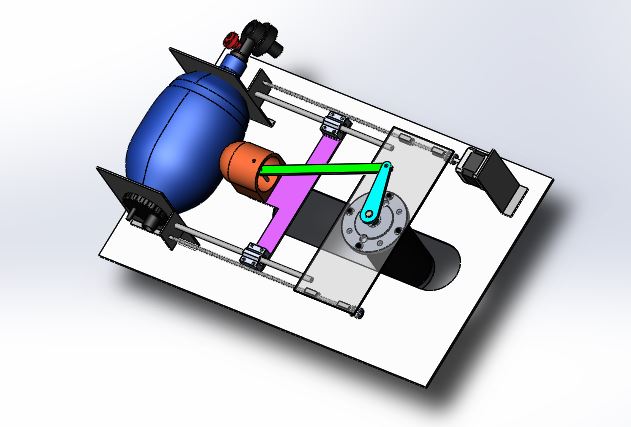
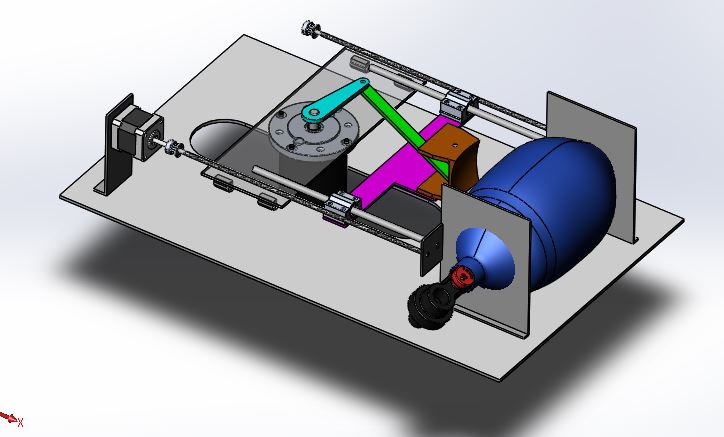
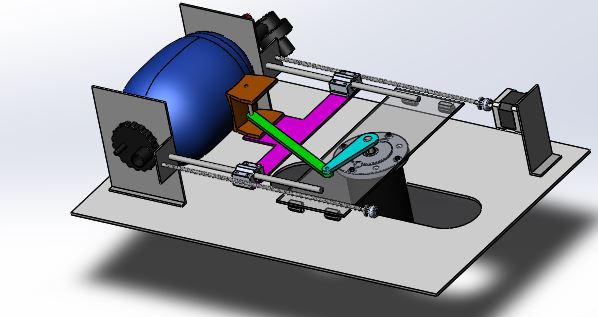
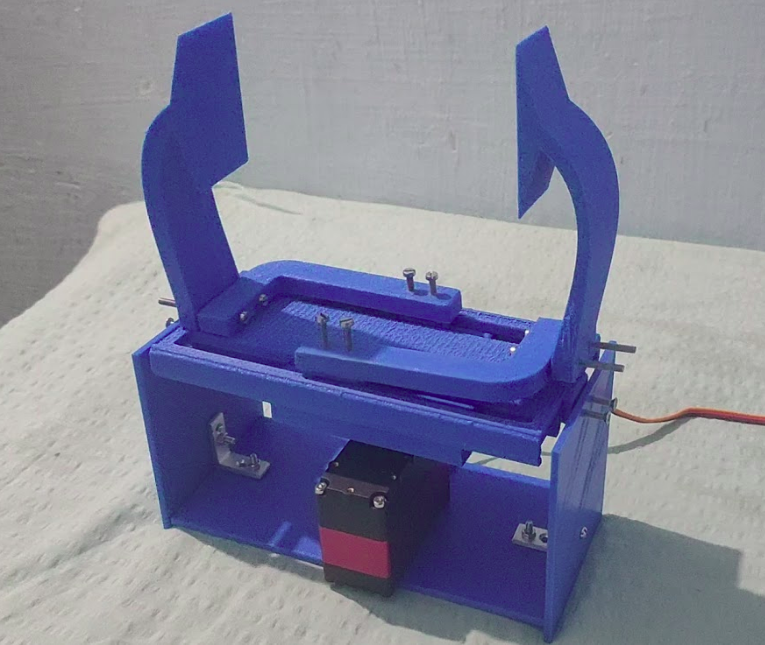
1.2. BVM-Ventilator Design
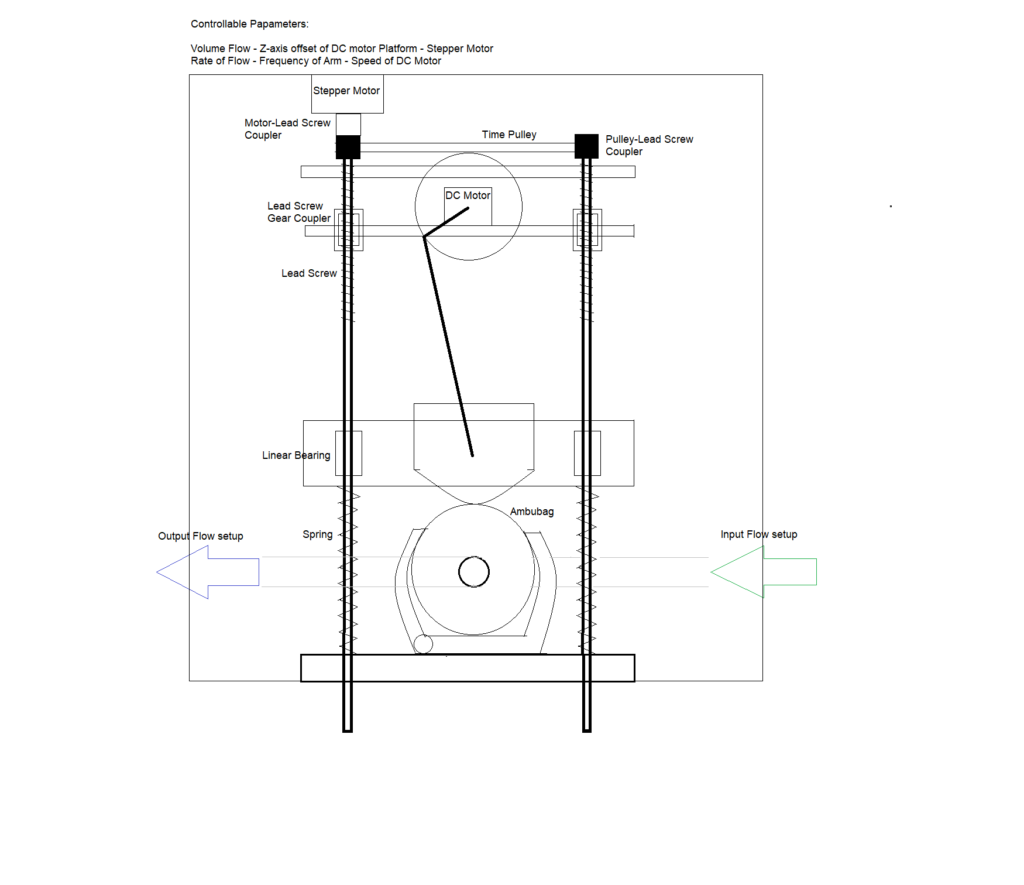
The ambu-bag is kept in a holder, connected to a slider-crank stage which is driven by a low RPM high torque motor. The speed control of the motor is able to adjust the patient’s breathing frequency. By adjusting the height of the motor- platform, the limit point of the arm is changed and therefore the tidal volume. Controlling the stepper motor, the tidal volume is adjusted and by controlling the high-torque DC motor, the rate of flow.
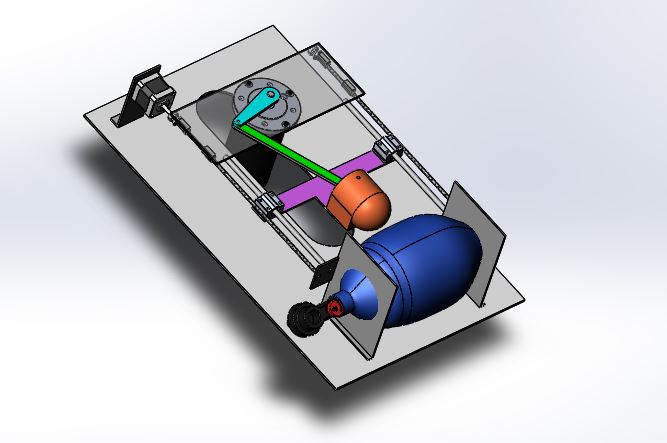
1.2.2. CAD Design
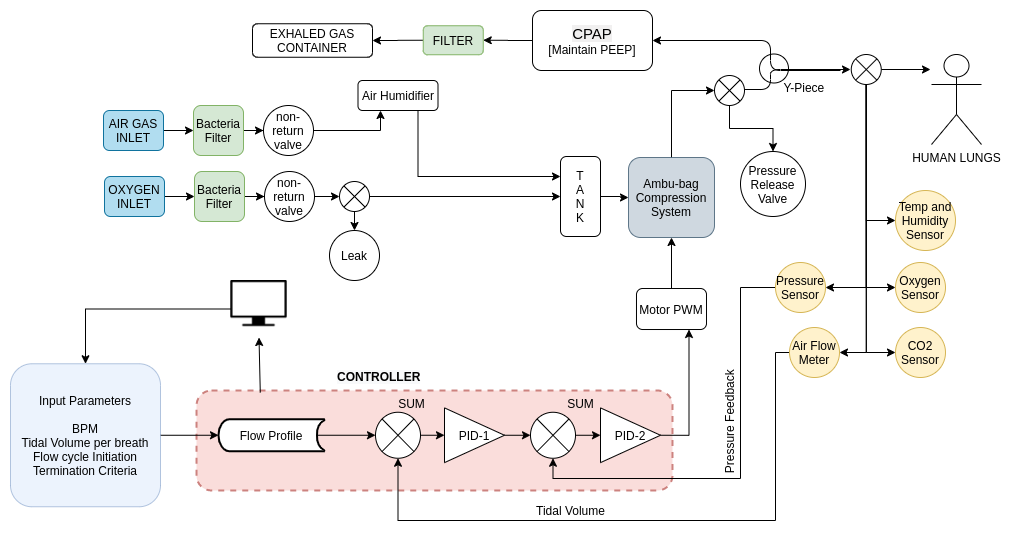
1.3. Electrical System Architecture
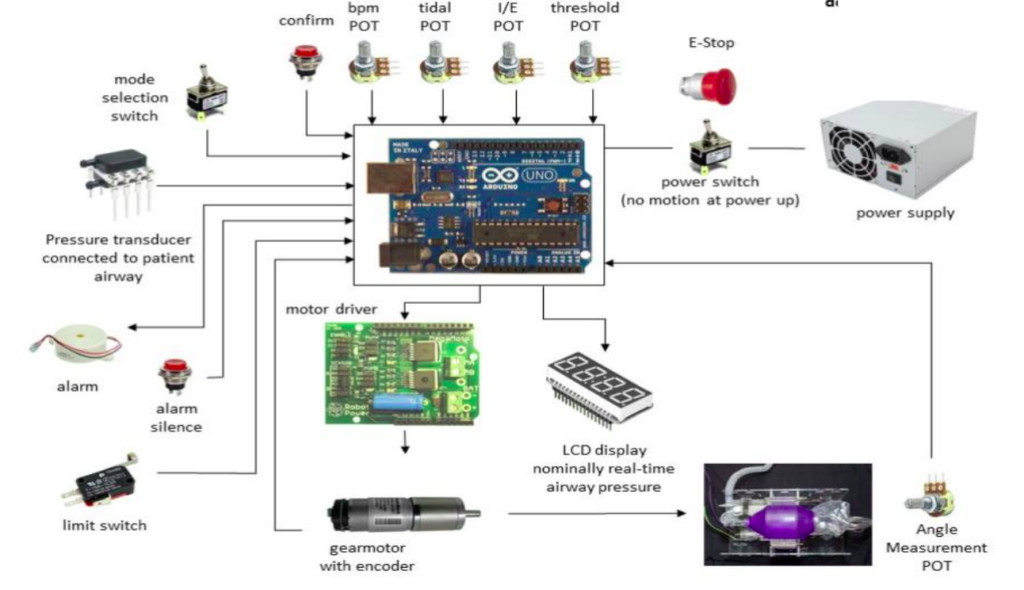
The above electrical system architecture diagram is used only for representation purpose, and is referred from MIT-open source ventilator project.
2. Controls and Simulation
The design ideas were presented in the last document. Consequently, in that path, a control system for the ventilator has been designed. The aim of the system, briefly, is to provide the required tidal volume to the lungs at the prescribed pressure at the breathing rate of the patient. In our case, the control system was developed in three stages and hence it would be explained accordingly. In stage 1, we developed a mathematical model based on the parameters of a normal lung. In the stage 2, we added a ventilator system to the under respiring lungs along with a controller. In stage 3, we tried to make the ventilator respond according to the breathing of the patient instead of a fixed breathing cycle. Hence, finally, we achieved a control system for the ventilator with a dynamic breathing cycle that assists the patient to breathe to the required tidal volume.
2.1. Stage One: Building a Multi-Compartment Model for Lungs
First, a system for the lung was developed. The multi-compartment model for lungs suggested by Michael C. [1]. It illustrates an analogical electrical model for the respiratory system as a multi-compartmental model. The electrical model is shown in Figure. Here we have taken the input to the lungs is the pressure and the output from the lungs is the airflow into and out of it. As shown in Figure, there are a few terms we need to define.
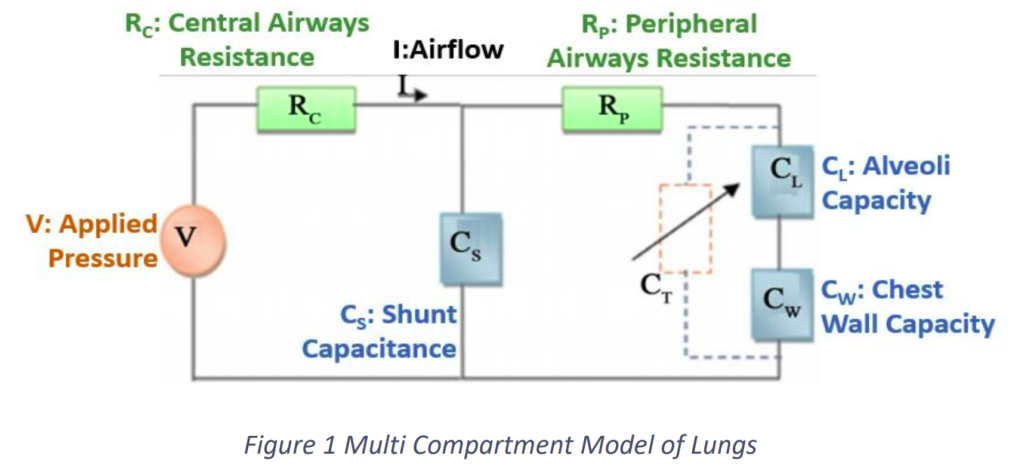
- V: The applied pressure on the lungs
- I: The airflow into and out of the lungs
- Rc: Airflow resistance of the central airways
- RP: Airflow resistance of the peripheral airways
- CL: The capacity of the alveoli
- CW: Chest wall capacity
- CS: ‘Shunt capacitance’ known as dead space of air, which does not participate in the exchange of oxygen and carbon dioxide between air and blood
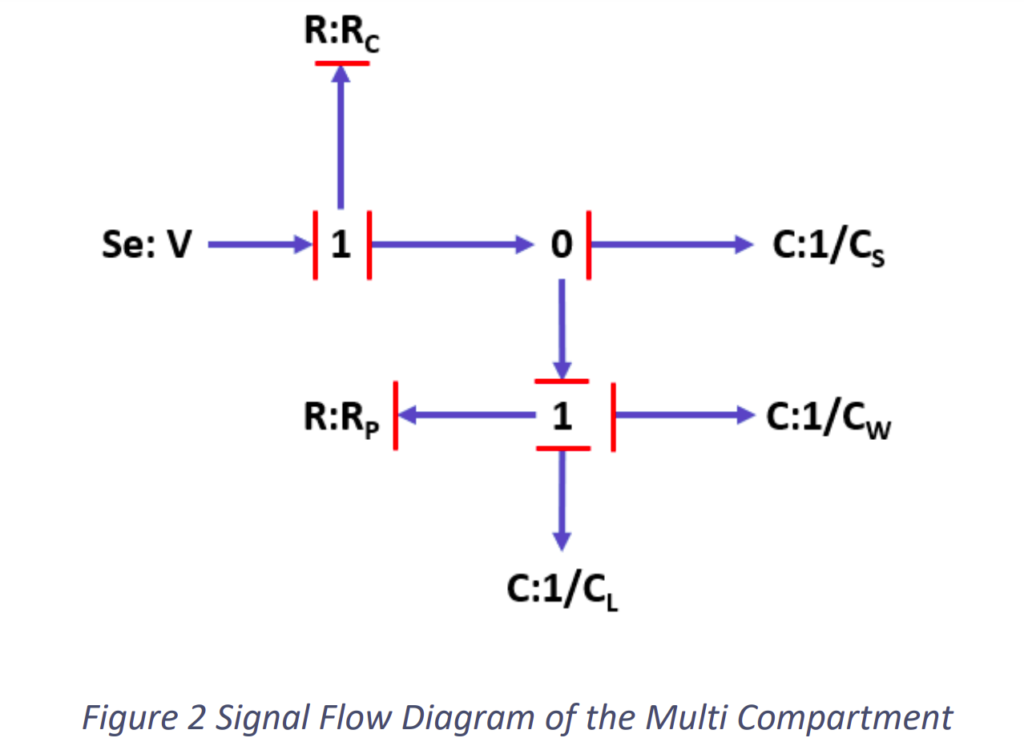
According to the system, the signal flow diagram was determined as shown in the Fig.2.2.
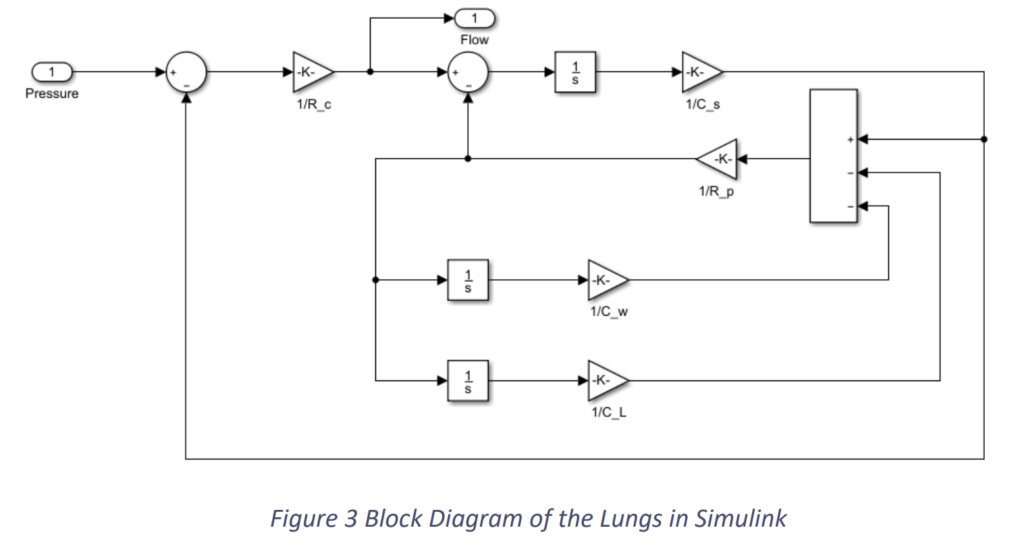
Subsequently, the block diagram was developed in Simulink with values of the parameters which refers to normal lungs. The block diagram in Simulink is shown in Fig.2.3 and the system with the input and output is shown in Fig.2.4.
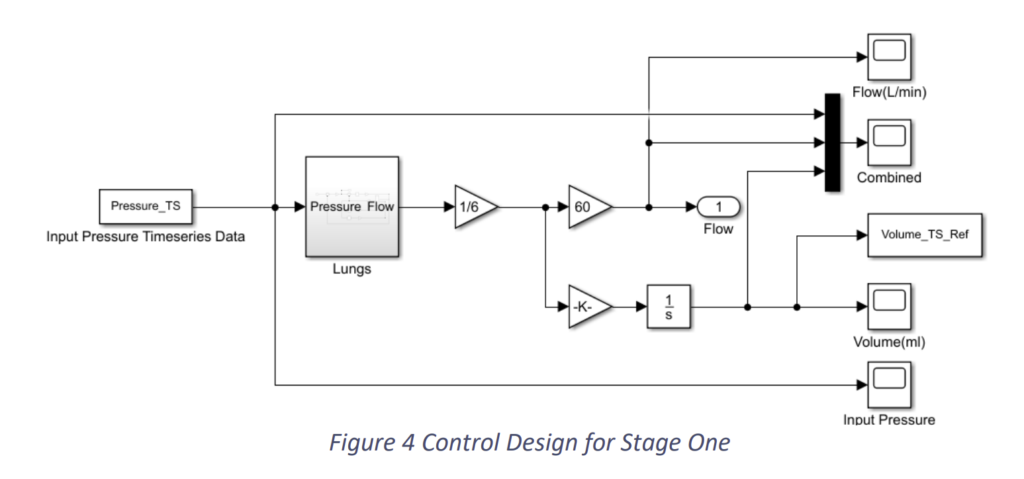
We provided an input pressure to the system taking reference from [2] as shown in Fig.2.5 and arrived at results as shown in Fig.2.6 and Fig.2.7.
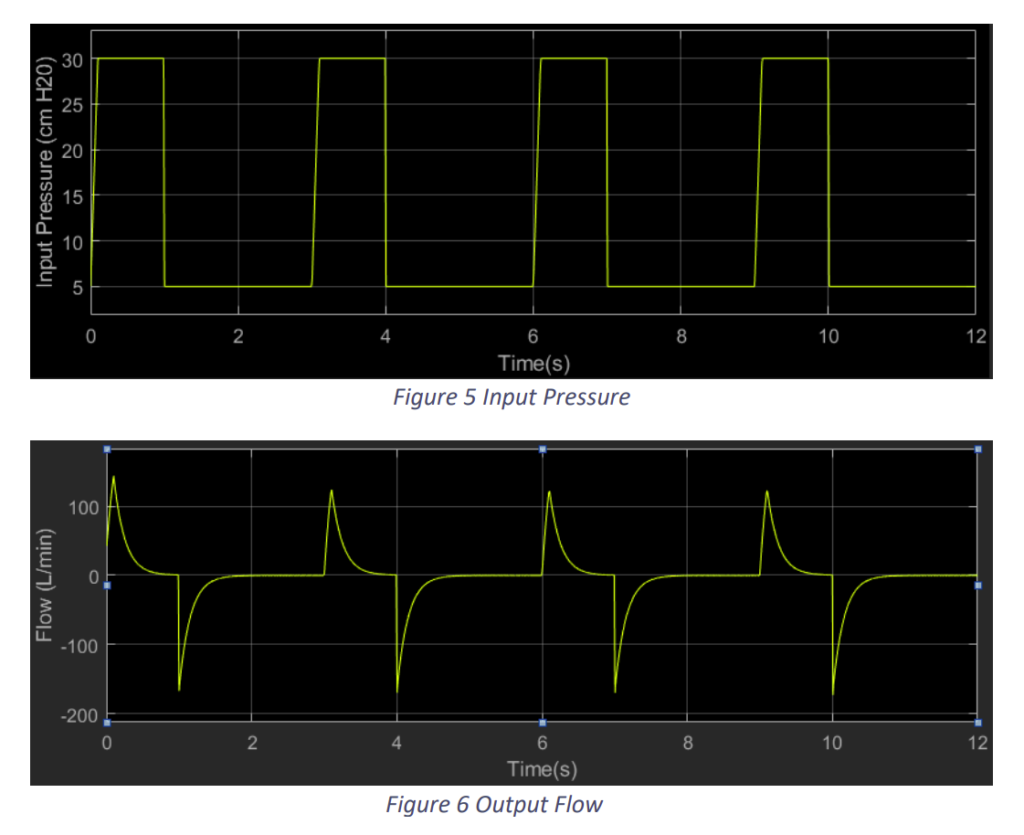
We observe that with an input pressure of 30 cm H2O from a plateau pressure of 5 cm H2O we in a breathing time of 3 seconds i.e. 20 bpm we attain a tidal volume of around 520 ml. This a typical example of a normal lung.
2.2. Stage Two: Applying Ventilation Support to an Under-Respiring Lungs System
An external ventilation support is required when a patient is unable to breathe to the required tidal volume. This may occur due to the inability or limited ability of lung muscles – diaphragm and ribs muscles. In a normal situation, these lung muscles create a negative pressure inside the lungs which pulls the air into the lungs. In ventilation support, we create a positive pressure outside to push air into the lungs. So, in this stage, we will limit the pressure created by the lungs which will result in low tidal volume in the lungs. Subsequently, we will add out ventilation support to achieve the required tidal volume.
2.2.1. An Under-Respiring Lungs
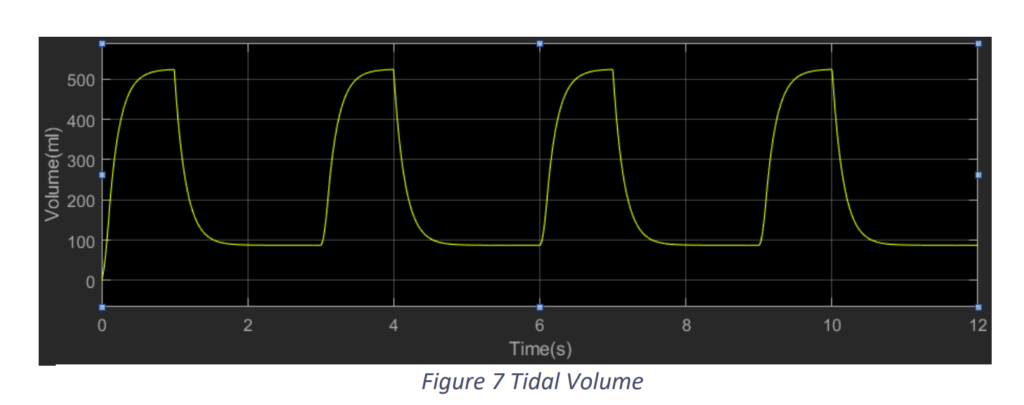
In the under-respiring lungs, we limited the input pressure to 15 cm H2O from a plateau pressure of 5 cm H2O as shown in Fig.8. Accordingly, we got results as shown in Fig.9 and Fig.10.
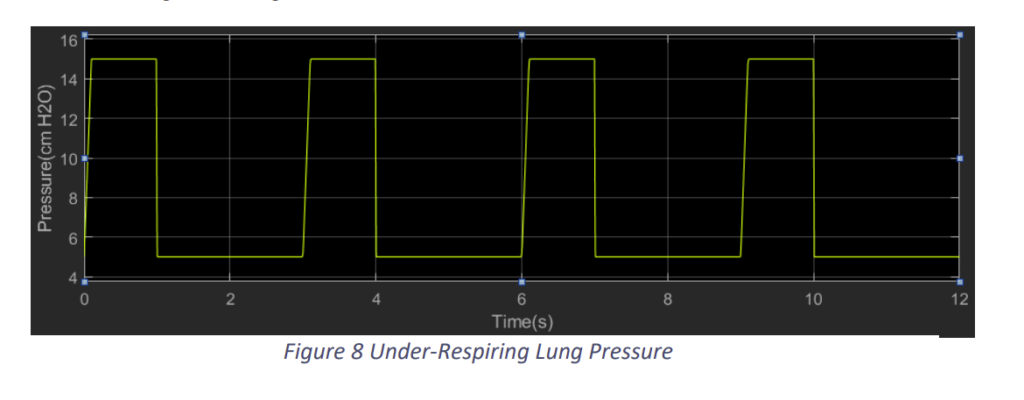
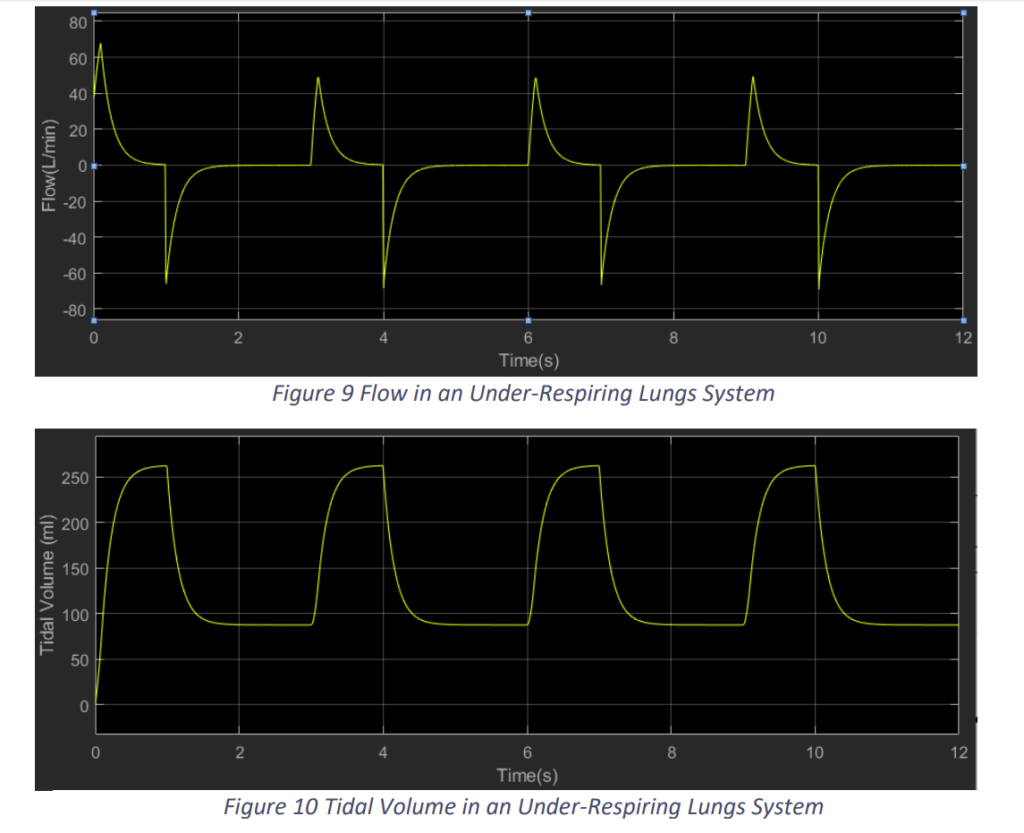
We observe that when the lungs muscle cannot produce enough negative pressure, the Flow into the lungs and the Tidal Volume achieved is lower than required. In Fig.9, we observe the tidal volume is around 260 ml, which as lower than the required.
2.2.2. Introducing a Ventilation Support System
Now we introduce a ventilation support system into it. This system takes a tidal volume reference from the prescribed or required tidal volume data of normal lungs. From this reference it calculates the error and typically minimises the error using a PID controller. The block diagram of the proposed system is shown in the Fig.11.
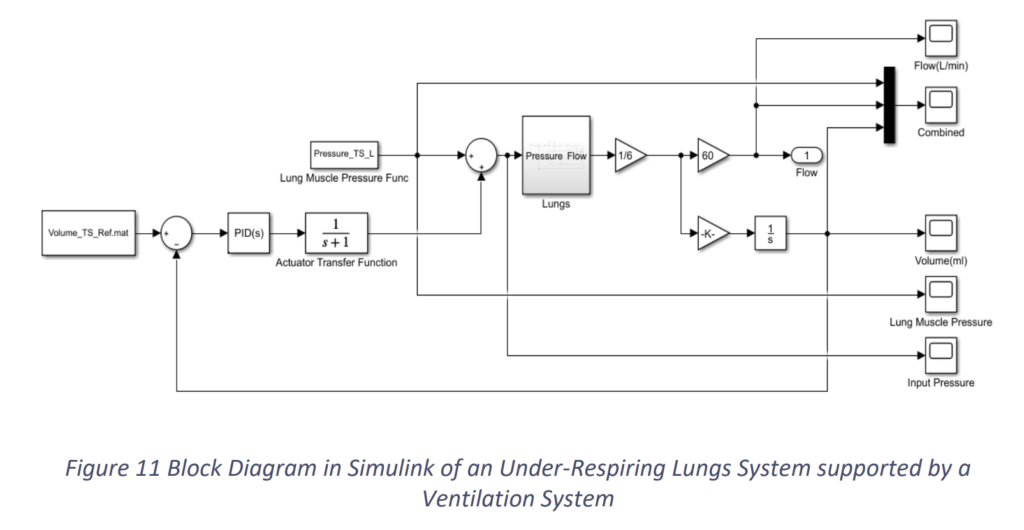
Here, we have taken a simple actuator transfer function, for at this point of time we have not fixed the design of our actuator. Based on the above block diagram and the same under-respiring lungs, when we run the simulation, we get the graphs as the following. Apparently, the constants of PID are Kp = 1, KI = 1 and KD = 0.
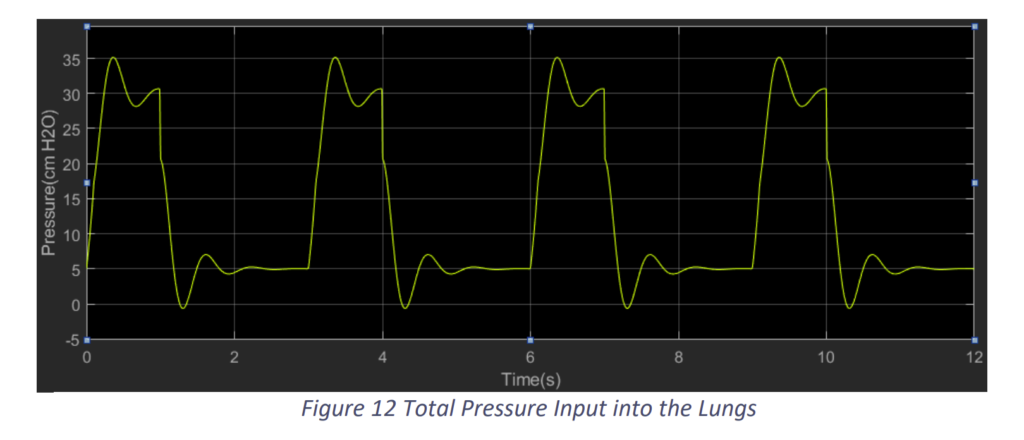
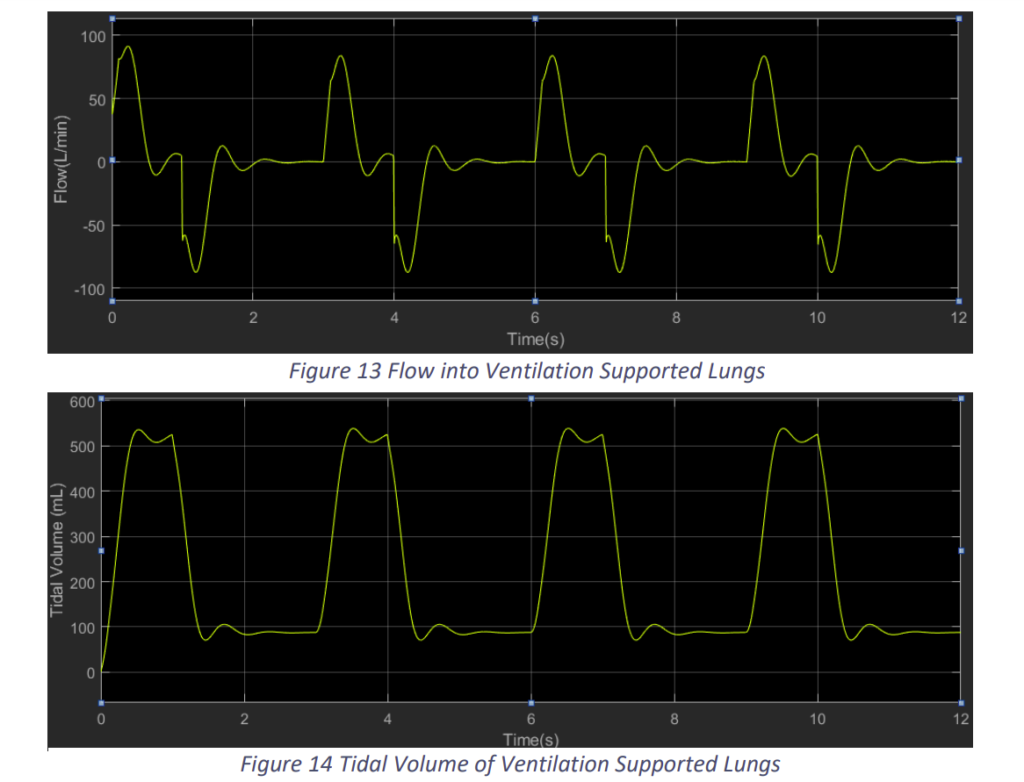
We see that with the proposed controller system of the ventilation support we are able to assist the lungs and provide the required tidal volume. The ventilation is able to provide the support in at the same frequency of the patient’s breathing rate. But, we can also observe that there are vibrations due to which the pressure is reaching 35 cm H2O, which may be harmful for the patient. Hence, we need to tune the PID controller for better results. So, we proceeded with Kp = 1, KI = 0 and KD = 1.
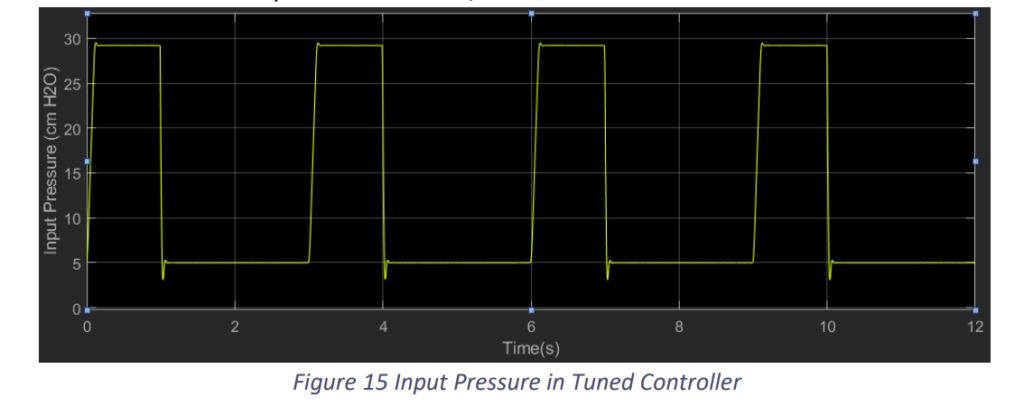
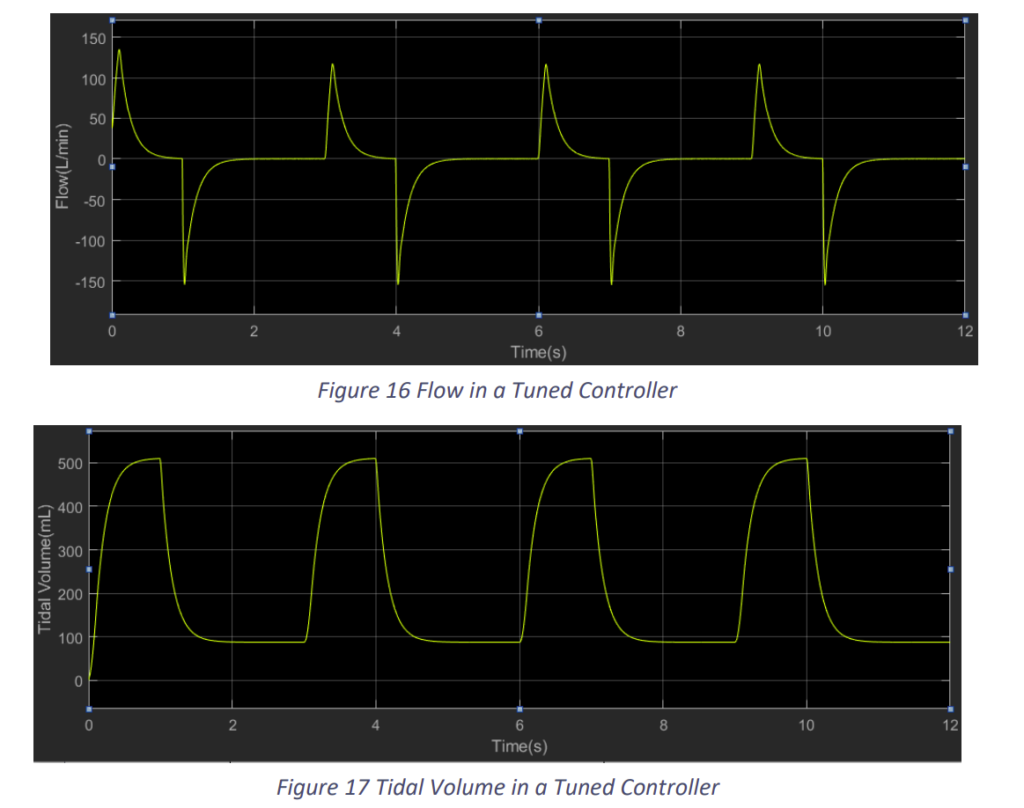
We observe that the results improved with the change in the constants. Nevertheless, tuning will get difficult in practical situation with the actuator. Still this control model would prove to be a decent model if tuned properly.
2.3 References
[1] Khoo, M.C.K. (2001) Physiological Control Systems: Analysis, Simulation, and Estimation. IEEE Press Series on Biomedical Engineering, New York, 1-319.
[2] Al-Naggar, Noman Q. “Modelling and Simulation of Pressure Controlled Mechanical Ventilation System.” Journal of Biomedical Science and Engineering, vol. 08, no. 10, 2015, pp. 707–716., doi:10.4236/jbise.2015.810068.
3.1 Further Research, Progress, and Updates
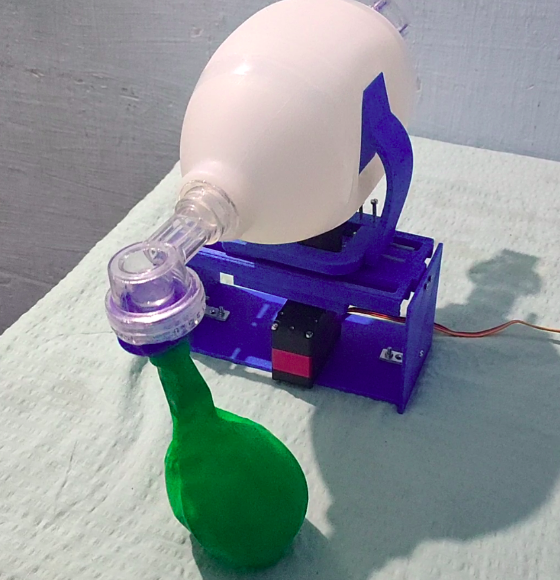
3.1.A. Prototype 1
We have successfully prototyped the air pumping mechanism using an Ambu bag. We are currently working on implementing a control interface using potentiometers and maintaining a PEEP of 10-15kPa using a centrifugal air fan attached to a high RPM motor. We will be using a Y connector in the path to pump the air from two sources, one of them being the Ambu bag, and the other would be PEEP. This method will help us maintain a minimum pressure of 10-15kPa and also reach a maximum of 40kPa. Both of these features will be implemented in the coming days.
Features that have been implemented
- 3D printable mechanical pressing design
- Compact and sturdy
- Sterilizable outer shield
- Closed-loop motor control
- Minimum pressure maintained
- Alarm in case of emergency
- Adjustable BPM (Breaths per minute) : 8-40BPM
- Adjustable I/E ratio (inspiratory/expiratory time ratio) : 1:1 – 1:4*
We have attached a few photos with the current status of the project.
3.1.B. Prototype 2
Work under progress
3.2.A. Updated Control Design
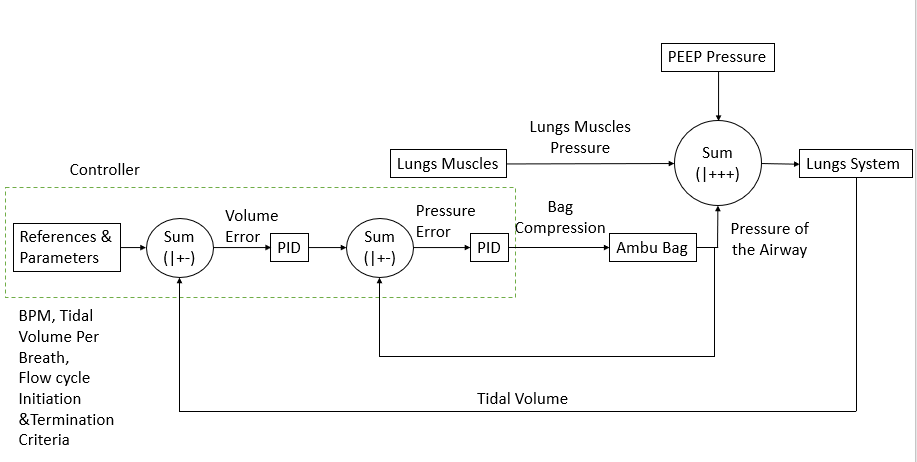
First, a Proportional Assistive Ventilation Model [1] was designed. Then it’s being developed to this, present in the report. The figure above briefly represents the modules present in our ventilator. The paper [2] was read in detail which provided a clear idea about the waveforms of Pressure of the Airway, Esophageal Pressure, Airflow into the lungs and the Tidal Volume. Pressure of the Airway is the positive pressure generated by the ventilator. Oesophagal pressure is the negative pressure generated due to the lung’s muscles. Airflow is the flow due the difference between the external pressure and internal pressure. Tidal Volume is the apparent volume of air held by the lungs. In the ventilator system, we only measure the Pressure of the Airway and the Airflow. Integrating the airflow provides the tidal volume. The paper [2] also gave an idea about how to trigger inspiration and expiration during the flow cycle.
As one can see the block diagram, there are certain modules on which work has to be done.
For lungs muscles, initially [2] was referred. Later, [3] was studied and tried. Finally, [4] was studied in detail. In [4], it proposes an RC Circuit model of lung’s muscles compression and relaxations. The profile of compression is like the charging of a capacitor in series with a resistor and the relaxation is like the discharging of the capacitor. But both the process has different rise time. This model was taken with some modifications to our control model. The merit of this model is that it was validated with active mechanical Lung ASL 5000, which is used for testing ventilators.
For Ambu Bag, we need to determine the pressure generated due to the compression of Ambu Bag. The controller gives the displacement to the Ambu Bag and accordingly the Ambu bag generates a pressure in the Airway. Initially, a simple proportional function was taken, i.e. the Pressure generated in the Airway is directly proportional to the displacement of compression. Later, it was realised that the transfer function is not very practical. An extensive search was done but no literature was found in this regard. So, taking a few considerations, a more practical function was determined.
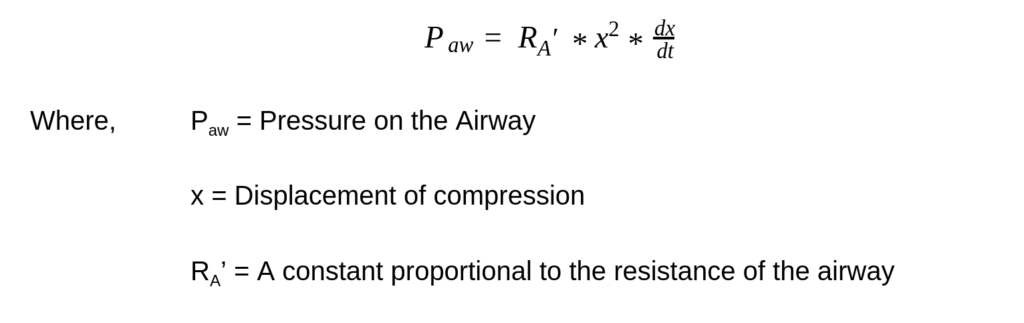
The details behind this derivation will be provided in the detailed report.
The lungs system basically has the parameter- the resistance and capacitance of the lungs. This is as described in the last document of controls design. Now this resistance and capacitance have a range of 2 to 3 cm H2O/L/sec and 0.1 to 0.4 L/cm H2O respectively, for normal lungs. But for a diseased lung, these parameters vary. We can classify lung diseases into restrictive lung diseases and obstructive lung diseases. In the case of restrictive lung diseases, there is a major decrease in the capacitance of the lungs. In case of obstructive lung diseases, there is a major increase in resistance of the lungs. The COVID-19, which shows pneumonia-like symptoms falls in the category of restrictive lung diseases. An analysis [5] about these diseases was studied in detail. This analysis provides us with the values of resistance and capacitance for certain important diseases.
The controller has two major functions. One is to control the compression of the Ambu Bag to generate desired pressure on the airway. Second is to trigger the ventilator for inspiration and expiration. For the first job, apparently, we are using a PID controller. But it seems, considering the transfer function of Ambu Bag, a second and third differential term could be added for better control. For the second job, apparently, we are using critical values-based trigger systems as mentioned in [2] and also being used by a lot of ventilators. There are few other models which can also be used. One of these is using EMG sensors. It’s been shown that triggers based on EMG sensors are quicker as compared to critical values-based triggers. With the EMG sensors available with us, we are trying to analyse the data acquired during the breathing cycle.
In the present situation, testing of the control model on normal lungs is complete. I am next proceeding with testing the model on several diseased lungs. We need to observe how the control parameters are required to be varied for different diseases. A few developments with the controller also need to be done and tested.
REFERENCES:
[1] Chatburn, Robert L., and Eduardo Mireles-Cabodevila. “Closed-loop control of mechanical ventilation: description and classification of targeting schemes.” Respiratory care 56.1 (2011): 85-102.
[2] Hess, Dean R. “Ventilator waveforms and the physiology of pressure support ventilation.” Respiratory Care 50.2 (2005): 166-186.
[3] Mecklenburgh, J. S., and W. W. Mapleson. “Ventilatory assistance and respiratory muscle activity. 2: Simulation with an adaptive active (“aa” or “a-squared”) model lung.” British journal of anaesthesia 80.4 (1998): 434-439.
[4] Fresnel, E., Muir, J. F., & Letellier, C. (2014). Realistic human muscle pressure for driving a mechanical lung. EPJ Nonlinear Biomedical Physics, 2(1), 7.
[5] Redlarski, G., & Jaworski, J. (2013). A new approach to modeling of selected human respiratory system diseases, directed to computer simulations. Computers in Biology and Medicine, 43(10), 1606-1613.
4. Ventilator Pressure Variation with Lung Diseases
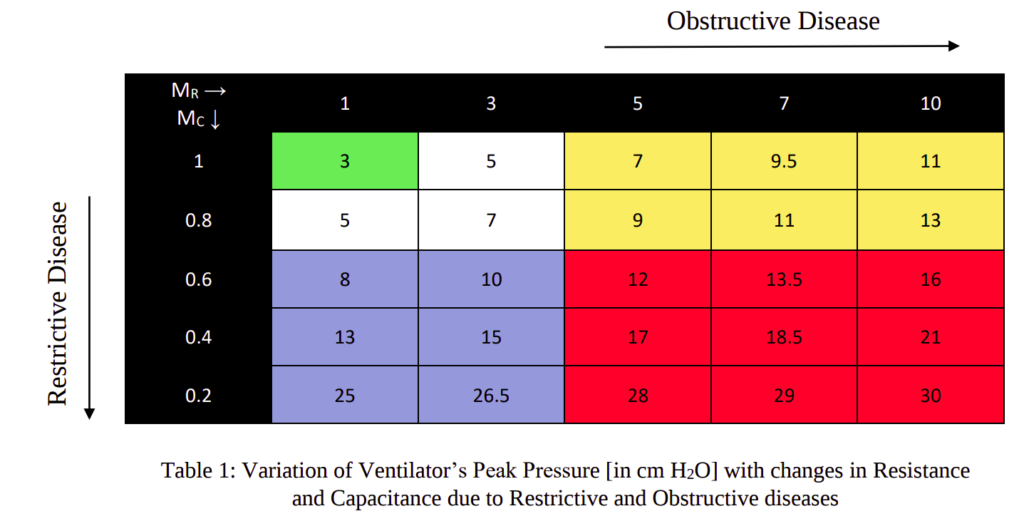
The objective of this study was to observe the changes in peak pressure of the ventilator with different diseases using the control system developed and compare it with practical results. In the electrical model of the lungs, initially, the resistance and capacitance were taken for a normal lung. A normal lung pressure due to lung muscles was applied without any ventilator to achieve a tidal volume in the range of 500 ml to 600 ml per breath. Now a ventilator was introduced to the normal lung to decrease the effort of the lung muscles. Hence, with a low muscle’s effort of 4.7 cm H2O and a peak ventilator pressure of 3 cm H2O, required tidal volume in 500-600 ml per breath was achieved. This is represented by the first block (green coloured) in Table 1.
Now, regarding diseases we know that, in case of restrictive lung diseases, there is a major decrease in the capacitance of the lungs. And in case of obstructive lung diseases, there is a major increase in resistance of the lungs. Hence in our next course of action, for restrictive lung disease, keeping the resistance constant, the capacitance was decreased in steps till 0.2 times and the difference was observed. The conditions were kept at low lung muscle’s effort of 4.7 cm H2O. The goal was to achieve tidal volume in the 500-600 ml range.
Similarly, for obstructive disease, keeping the capacitance constant, the resistance was increased in steps till 10 times and the changes in pressure was observed. The conditions and goals were the same as above. In this way, we covered 25 possibilities which mostly covered the complete range of situations of restrictive and obstructive diseases. The results are presented in Table 1.
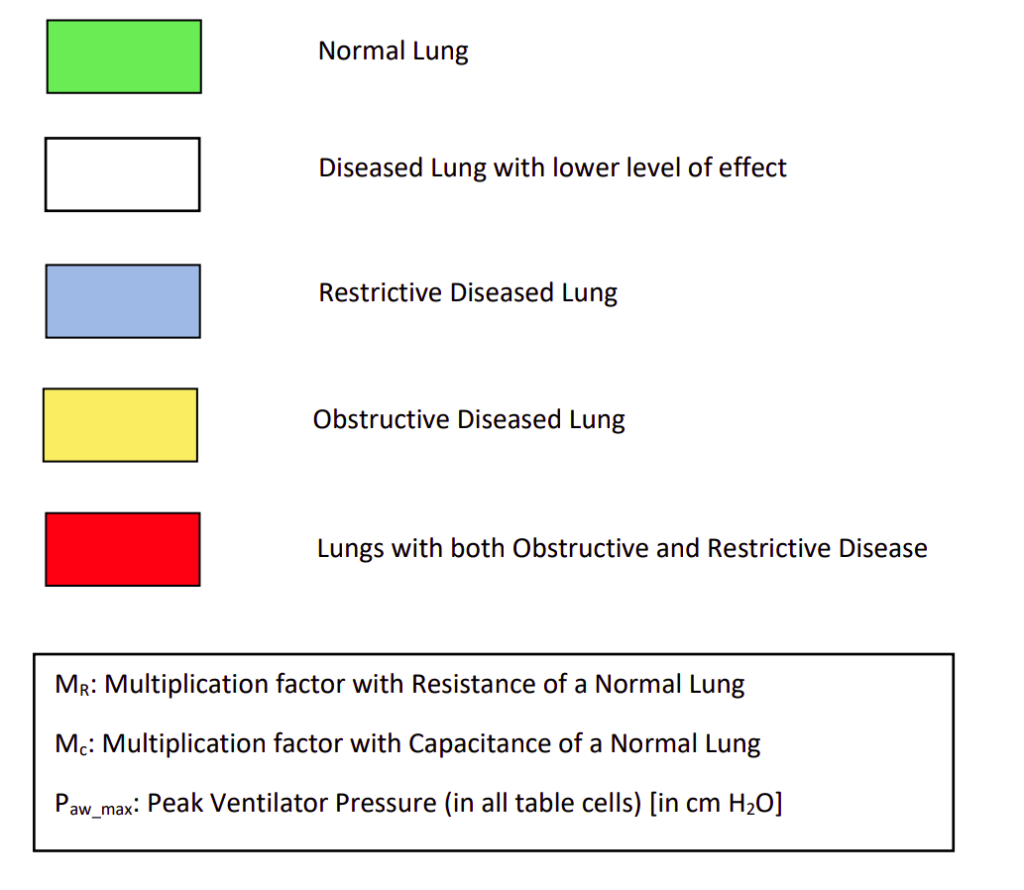
The first green block represents the parameters of normal lungs under low muscle’s effort using a ventilator for minimal support. In the next white blocks, we see decrease in capacitance and increase in resistance. Though this is not normal, these situations use very low support of ventilators. These situations can be managed only with lung muscle pressure without any ventilator. The extent of restrictive or obstructive disease is very low here.
The blue blocks in the table represent situations of restrictive diseases. Since the capacitance of lungs has decreased, a higher pressure is required to get the required tidal volume of the lungs. The yellow blocks represent the situations of obstructive diseases. Since the resistances of the lungs and peripheral airway have increased, it offers more resistance to the flow. Hence ideally, it will take more time for saturation. So, a larger pressure would help to reach the required tidal volume before exhalation starts. The red blocks in the table represent the presence of both restrictive and obstructive conditions. These are rare conditions but are present. The ventilator should be efficient even in these cases. We see that the peak pressure increases as we move to the bottom right corner since both the condition intensifies.
It is prescribed that the input pressure to the lungs, i.e. the airway and esophageal pressure difference should be 35 cm H2O. We can observe in the table that, after adding the lungs muscle’s pressure 4.7 cm H2O to the peak ventilator pressure, the peak input pressure mostly stays within 30 cm H2O, except for few which remains within 35 cm H2O.
The results achieved here were compared with data given in [1] and [2] and it stays very similar. The waveforms of airway pressure, flow and tidal volume were also compared, and the pattern remains the same. A detailed document regarding the waveforms of our control system will be prepared soon.
REFERENCES
[1] Hess, Dean R. “Ventilator waveforms and the physiology of pressure support ventilation.” Respiratory Care 50.2 (2005): 166-186.
[2] Fresnel, E., Muir, J. F., & Letellier, C. (2014). Realistic human muscle pressure for driving a mechanical lung. EPJ Nonlinear Biomedical Physics, 2(1), 7.